Weekly Housing Market Report – Katy & Fulshear – Week 14 March 30, 2026 – April 5, 2026
Katy
Market Appreciation or Depreciation
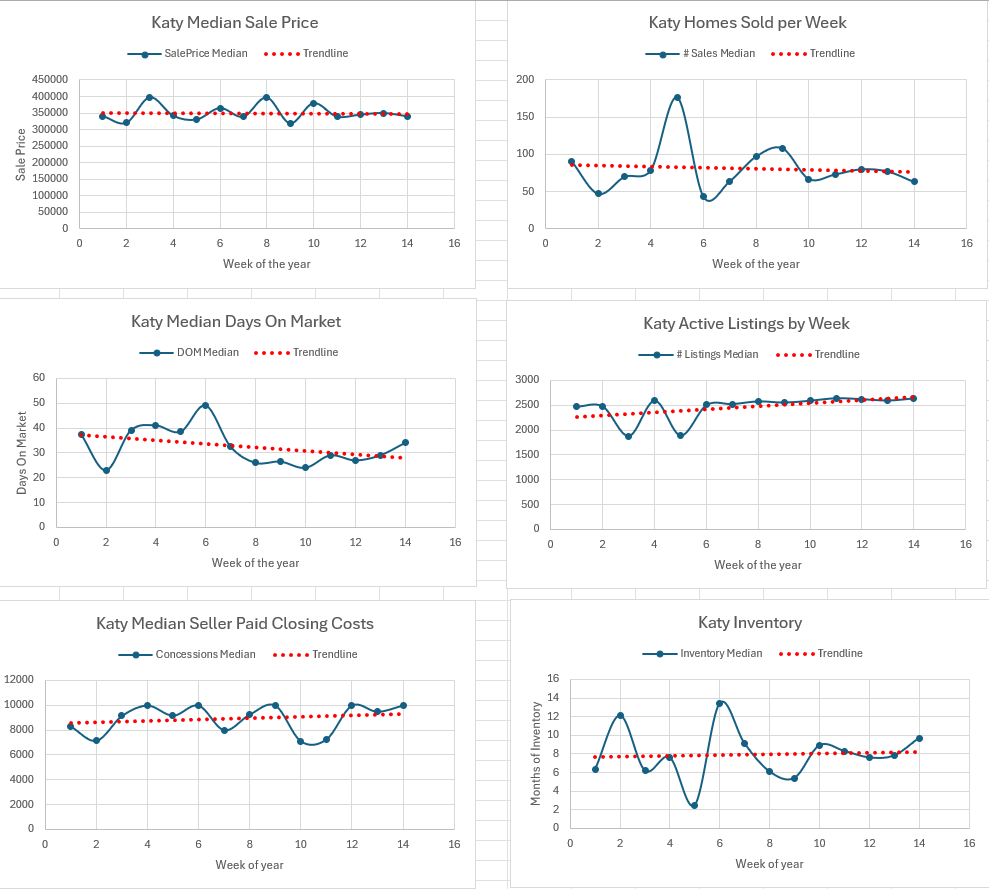
The median closed price in Katy this week was $340,000, from $349,900 last week (↓ 2.8%).
Number of Closed Sales
63 homes closed this week in Katy, from 77 last week (↓ 18.2%).
Median Days on Market (DOM)
34.0 days, from 29.0 days last week (↑ 17.2%).
Number of Listings (Total Inventory)
There were 2,641 total listings this week in Katy, from 2,598 last week (↑ 1.7%).
Months of Inventory
Based on the current sales pace, Katy has 9.7 months of housing inventory, from 7.8 months last week (↑ 24.4%).
Listing Breakdown
Active (A): 1,981 listings (↑ 0.8%)
Option Pending (OP): 92 listings (↓ 4.2%)
Pending Continue to Show (PSHO): 0 listings (→ no change)
Pending (P): 568 listings (↑ 5.8%)
Seller Concessions Over $1
Percentage of Sales with Concessions: 61.9% (↑ 6.0%)
Median Concession: $10,000 (↑ 5.3%)
Katy – Week 14 Market Insight
Katy’s housing market remained relatively stable this week, with median prices holding steady despite a decline in sales activity.
Closed sales decreased compared to last week, suggesting a short-term slowdown in buyer activity. However, days on market remained fairly consistent overall, indicating that well-priced homes are still moving at a typical pace.
Inventory levels increased slightly, continuing an upward trend that points toward gradually improving supply. At the same time, seller concessions remain elevated, reflecting ongoing competition among sellers and continued sensitivity from buyers.
Overall, the Katy market appears to be transitioning toward more balanced conditions, with steady pricing but increasing pressure from rising inventory levels.
Fulshear
Market Appreciation or Depreciation
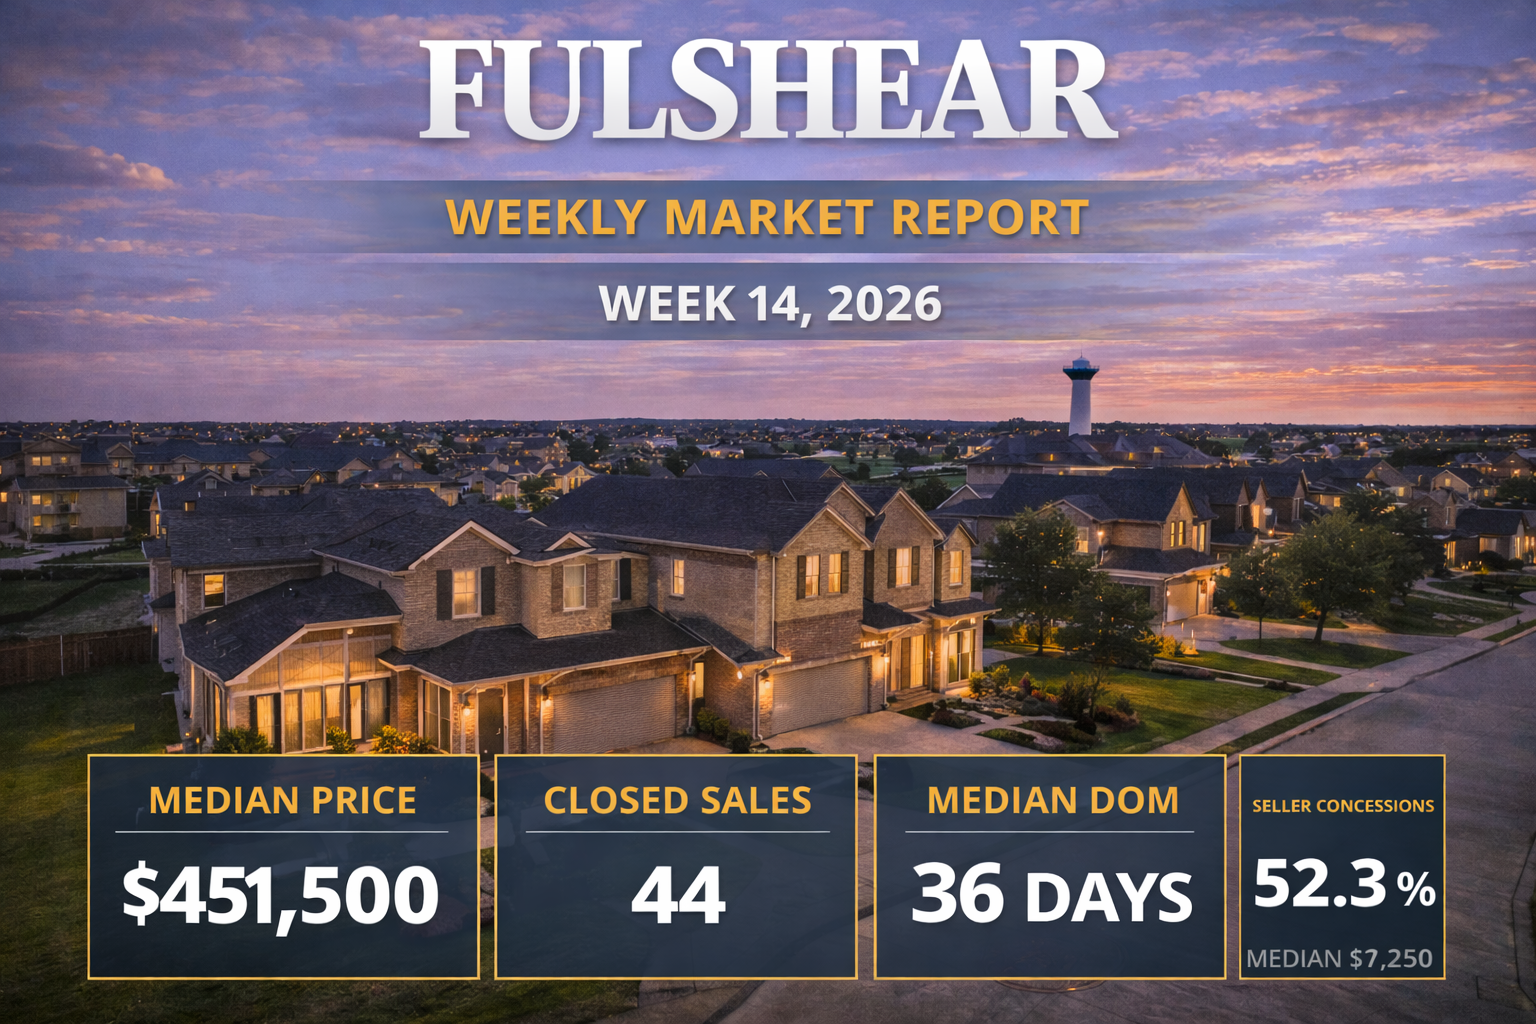
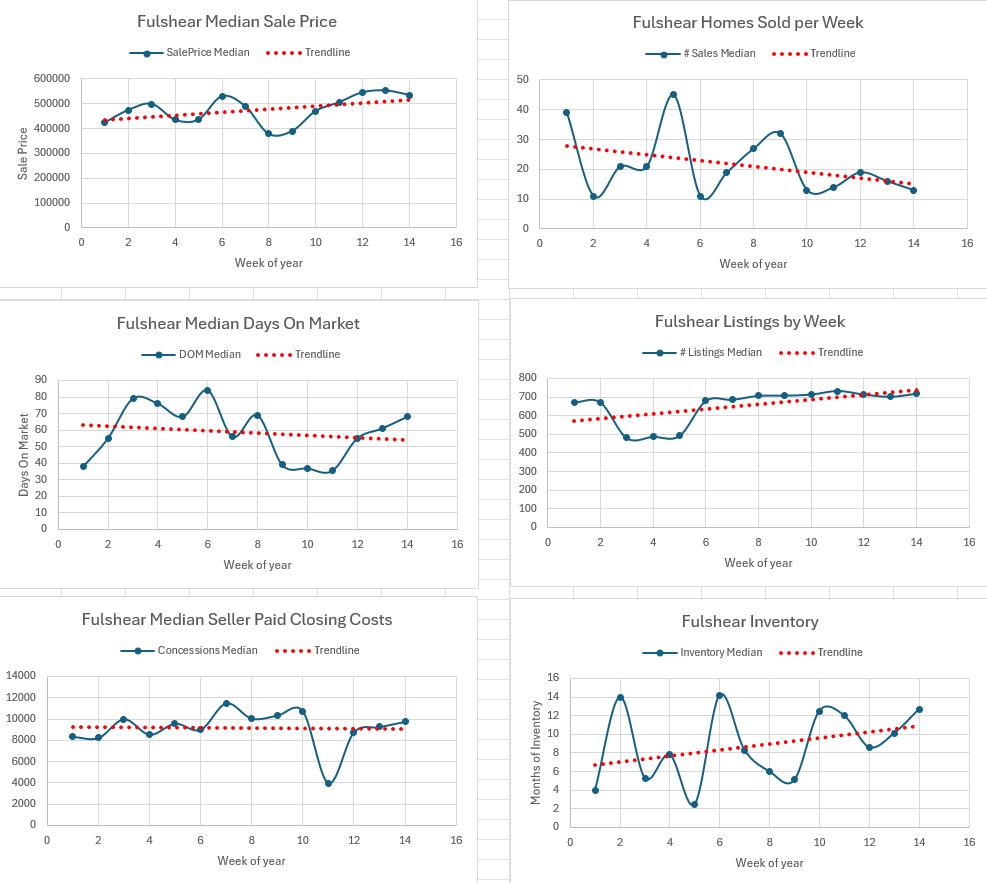
The median closed price in Fulshear this week was $535,000, from $552,500 last week (↓ 3.2%).
Number of Closed Sales
13 homes closed this week in Fulshear, from 16 last week (↓ 18.8%).
Median Days on Market (DOM)
68.0 days, from 61.0 days last week (↑ 11.5%).
Number of Listings (Total Inventory)
There were 718 total listings this week in Fulshear, from 701 last week (↑ 2.4%).
Months of Inventory
Based on the current sales pace, Fulshear has 12.7 months of housing inventory, from 10.1 months last week (↑ 25.7%).
Listing Breakdown
Active (A): 546 listings (↑ 2.2%)
Option Pending (OP): 11 listings (↑ 22.2%)
Pending Continue to Show (PSHO): 1 listings (↑ new)
Pending (P): 160 listings (↑ 1.3%)
Seller Concessions Over $1
Percentage of Sales with Concessions: 53.8% (↑ 7.6%)
Median Concession: $9,750 (↑ 5.4%)
Legal Disclaimer
The information provided in this report is for informational purposes only and should not be considered financial, legal, or real estate advice. Data is derived from closed sales reported in the MLS and may be revised as late or corrected entries are posted.
Fulshear – Week 14 Market Insight
Fulshear’s housing market continues to show underlying strength, with median prices trending upward despite a decline in weekly sales activity.
Closed sales decreased this week, which appears consistent with recent volatility rather than a clear shift in demand. At the same time, days on market have begun to increase from recent lows, suggesting a slight easing in buyer urgency.
Inventory levels continue to trend upward, indicating growing supply in the market. Seller concessions remain elevated overall, reflecting increased competition and the need for sellers to position properties effectively.
Overall, while pricing remains strong, the combination of rising inventory and longer marketing times suggests the market may be gradually transitioning toward more balanced conditions.