

Weekly Housing Market Report – Richmond, Rosenberg & Sugar Land – Week 15 April 6, 2026 – April 12, 2026
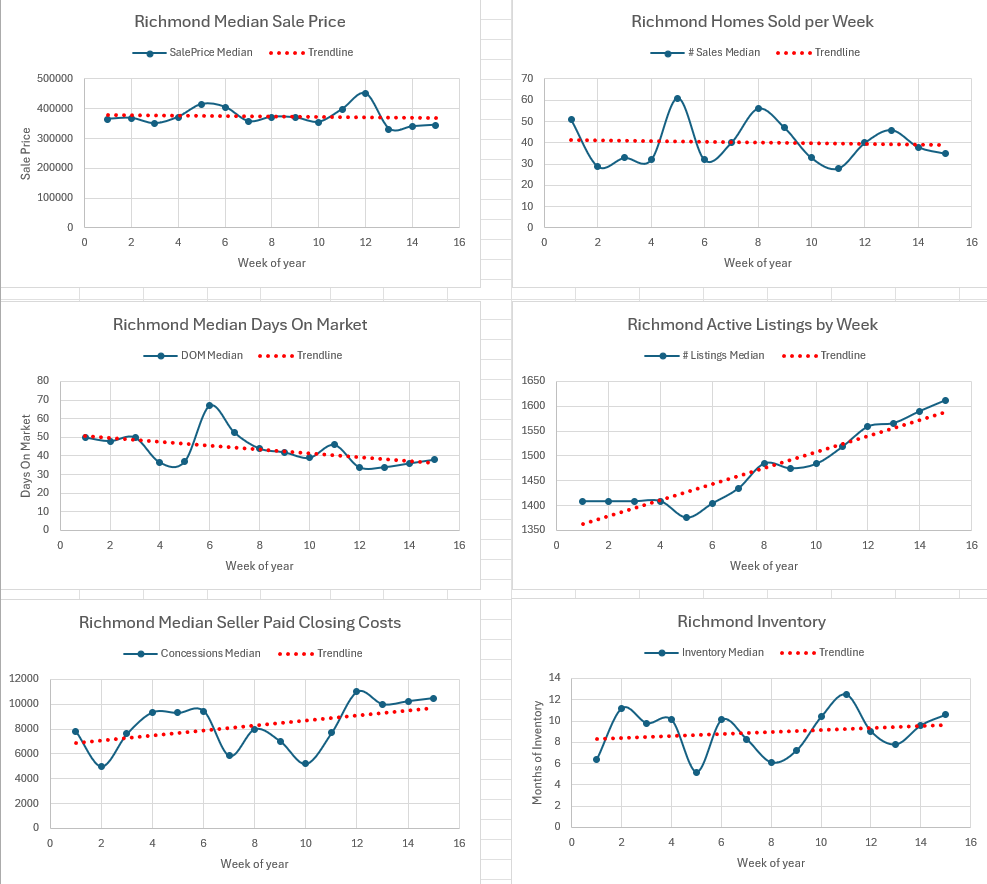
Richmond
Market Appreciation or Depreciation
The median closed price was $345,000, from $340,000 last week (↑ 1.5%).
Number of Closed Sales
35 homes closed this week, from 38 last week (↓ 7.9%).
Median Days on Market (DOM)
38.0 days, from 36.0 days last week (↑ 5.6%).
Number of Listings (Total Inventory)
There were 1,612 total listings this week, from 1,590 last week (↑ 1.4%).
Months of Inventory
Based on the current sales pace, Richmond has 10.6 months of housing inventory, from 9.6 months last week (↑ 10.4%).
Listing Breakdown
Active (A): 1,195 listings (↑ 1.4%)
Option Pending (OP): 30 listings (↑ 3.4%)
Pending Continue to Show (PSHO): 24 listings (↓ 4.0%)
Pending (P): 363 listings (↑ 1.4%)
Seller Concessions Over $1
Percentage of Sales with Concessions: 54.3% (↑ 3.2%)
Median Concession: $10,500 (↑ 2.4%)
Richmond – Week 15 Market Insight
Richmond’s median price increased this week, continuing the trend of stable pricing. However, closed sales declined while days on market increased, indicating a slower pace of transactions. Inventory continues to build, with months of inventory rising to 10.6 months, reflecting increased supply relative to demand. Seller concessions also moved higher, suggesting continued negotiation between buyers and sellers. Overall, the market is showing price stability, but with a gradual shift toward a more buyer-leaning environment as inventory expands and absorption slows.
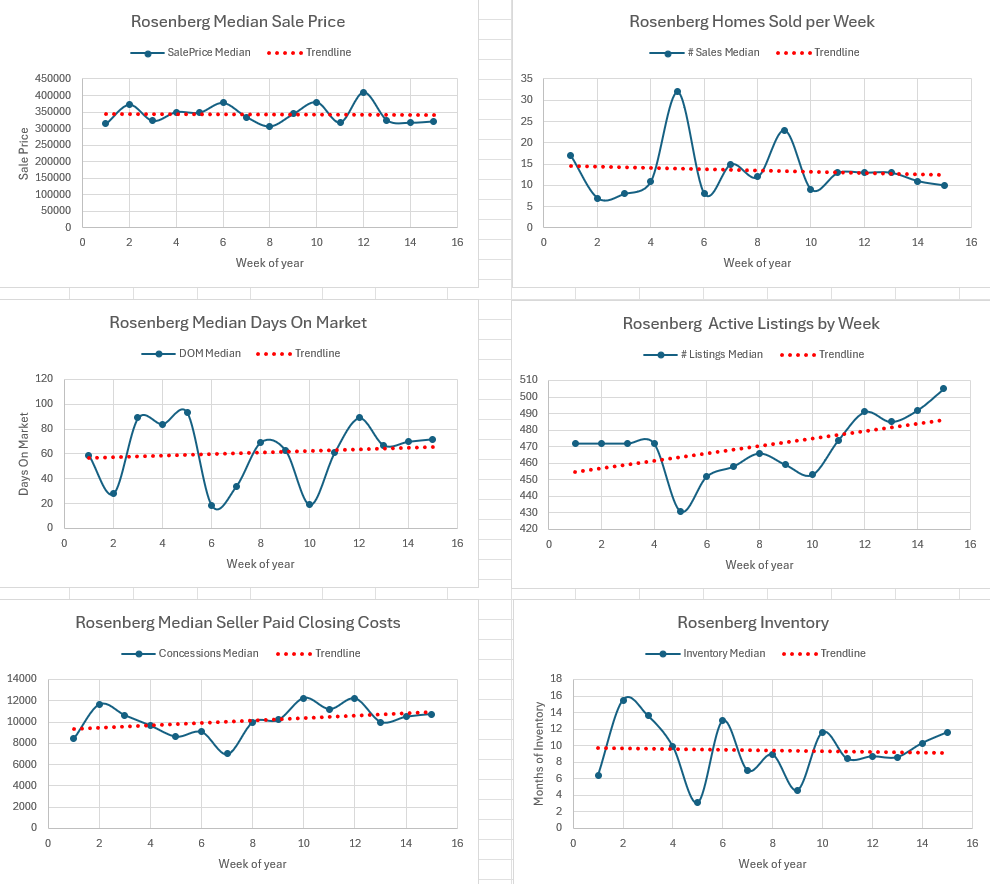
Rosenberg
Market Appreciation or Depreciation
The median closed price was $322,000, from $318,000 last week (↑ 1.3%).
Number of Closed Sales
10 homes closed this week, from 11 last week (↓ 9.1%).
Median Days on Market (DOM)
72.0 days, from 70.0 days last week (↑ 2.9%).
Number of Listings (Total Inventory)
There were 505 total listings this week, from 492 last week (↑ 2.6%).
Months of Inventory
Based on the current sales pace, Rosenberg has 11.6 months of housing inventory, from 10.3 months last week (↑ 12.6%).
Listing Breakdown
Active (A): 358 listings (↑ 2.9%)
Option Pending (OP): 10 listings (↑ 11.1%)
Pending Continue to Show (PSHO): 28 listings (→ 0%)
Pending (P): 109 listings (↑ 1.9%)
Seller Concessions Over $1
Percentage of Sales with Concessions: 70.0% (↓ 3.7%)
Median Concession: $10,750 (↑ 2.4%)
Rosenberg – Week 15 Market Insight
Rosenberg’s median price increased this week, continuing a pattern of stable pricing. However, closed sales declined and days on market increased, indicating a slower pace of transactions. Inventory continues to build, with months of inventory rising to 11.6 months, reflecting increased supply relative to demand. Seller concessions remain elevated, although slightly lower than last week, suggesting sellers are still negotiating to get deals across the finish line. Overall, the market is showing stable pricing, but with a continued shift toward a buyer-leaning environment as inventory expands and absorption slows.
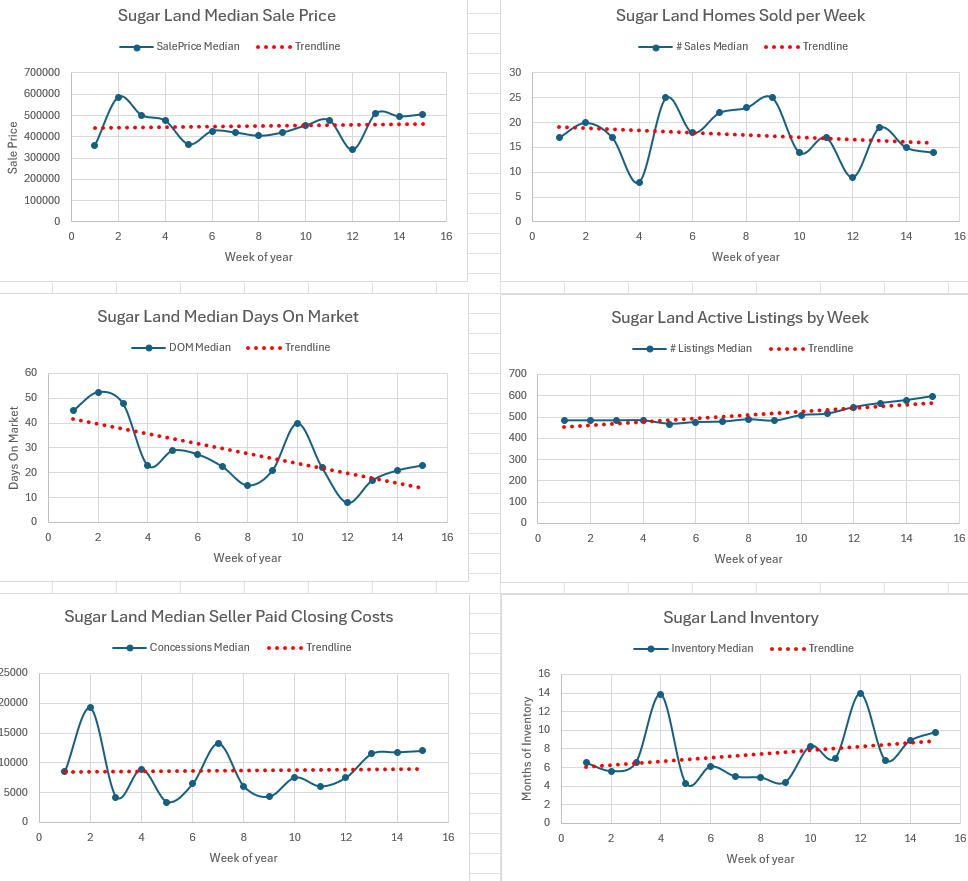
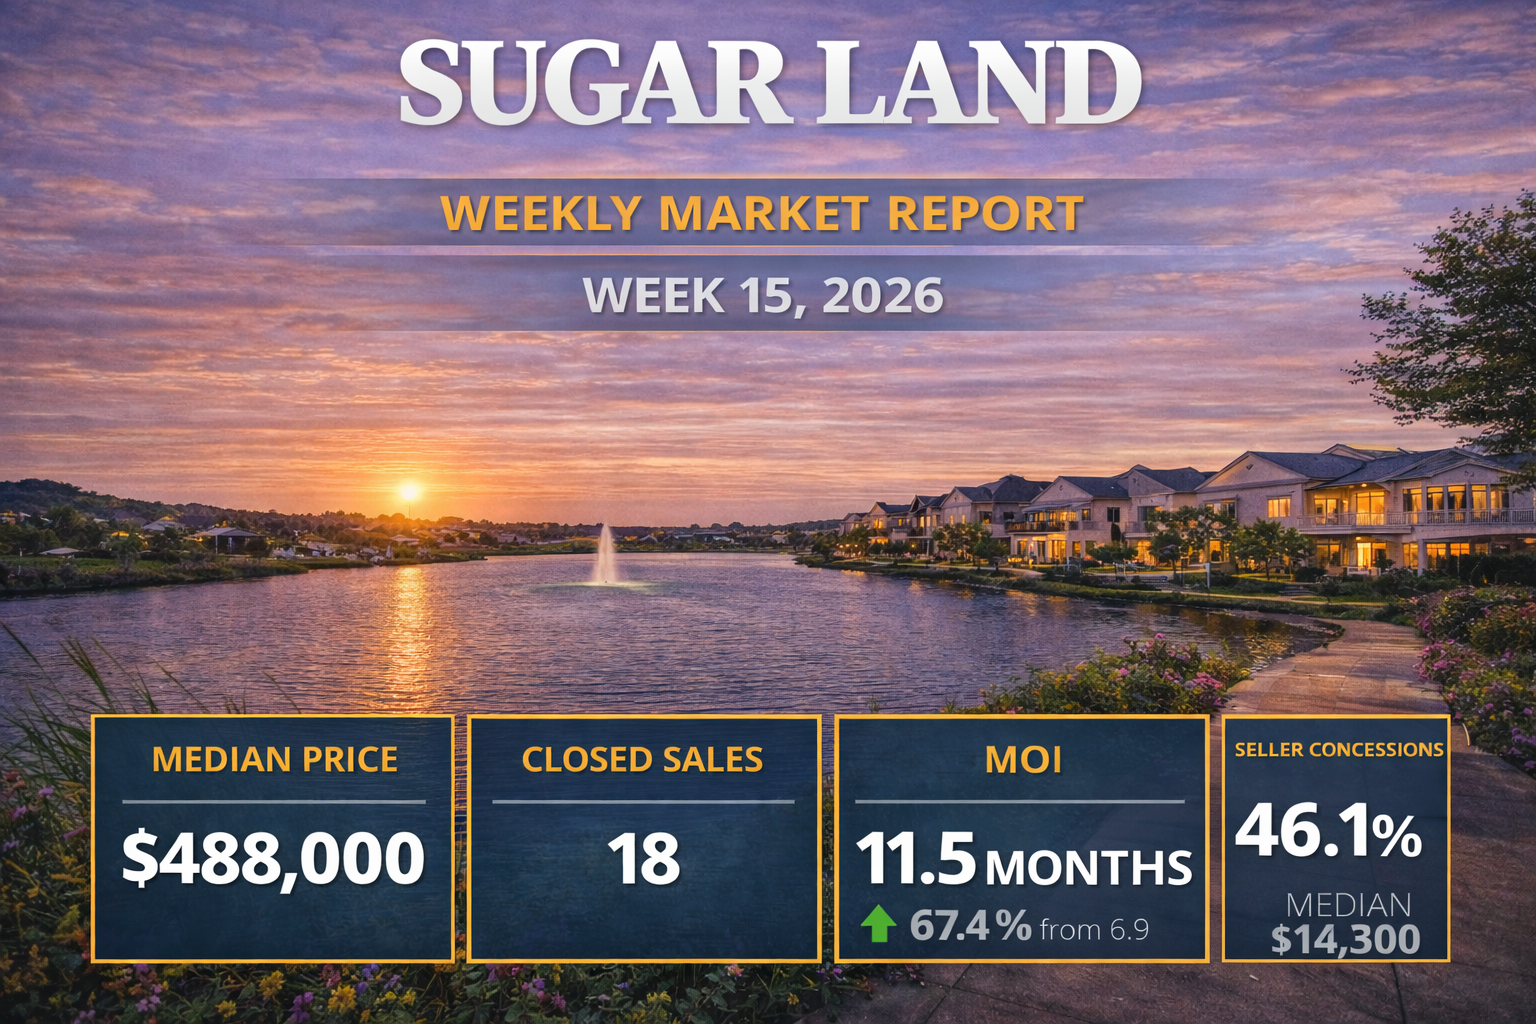
Sugar Land
Market Appreciation or Depreciation
The median closed price was $505,000, from $495,000 last week (↑ 2.0%).
Number of Closed Sales
14 homes closed this week, from 15 last week (↓ 6.7%).
Median Days on Market (DOM)
23.0 days, from 21.0 days last week (↑ 9.5%).
Number of Listings (Total Inventory)
There were 598 total listings this week, from 579 last week (↑ 3.3%).
Months of Inventory
Based on the current sales pace, Sugar Land has 9.8 months of housing inventory, from 8.9 months last week (↑ 10.1%).
Listing Breakdown
Active (A): 472 listings (↑ 3.1%)
Option Pending (OP): 21 listings (↓ 4.5%)
Pending Continue to Show (PSHO): 10 listings (↑ 11.1%)
Pending (P): 95 listings (↑ 5.6%)
Seller Concessions Over $1
Percentage of Sales with Concessions: 35.7% (↑ 2.4%)
Median Concession: $12,000 (↑ 2.1%)
Legal Disclaimer
The information provided in this report is for informational purposes only and should not be considered financial, legal, or real estate advice. Data is derived from closed sales reported in the MLS and may be revised as late or corrected entries are posted.
Sugar Land – Week 15 Market Insight
Sugar Land’s median price increased this week, continuing the trend of stable to upward pricing. While closed sales declined slightly, days on market increased, indicating a modest slowing in transaction pace. Inventory continues to build, with months of inventory rising to 9.8 months, but remains lower than surrounding markets. Seller concessions also increased slightly, suggesting some continued negotiation. Overall, Sugar Land remains the strongest of the three markets, with stable pricing and relatively lower inventory levels, despite early signs of a gradual shift toward more balanced conditions.