

Weekly Housing Market Report – Richmond, Rosenberg, and Sugar Land – Week 13 March 23, 2026 – March 29, 2026
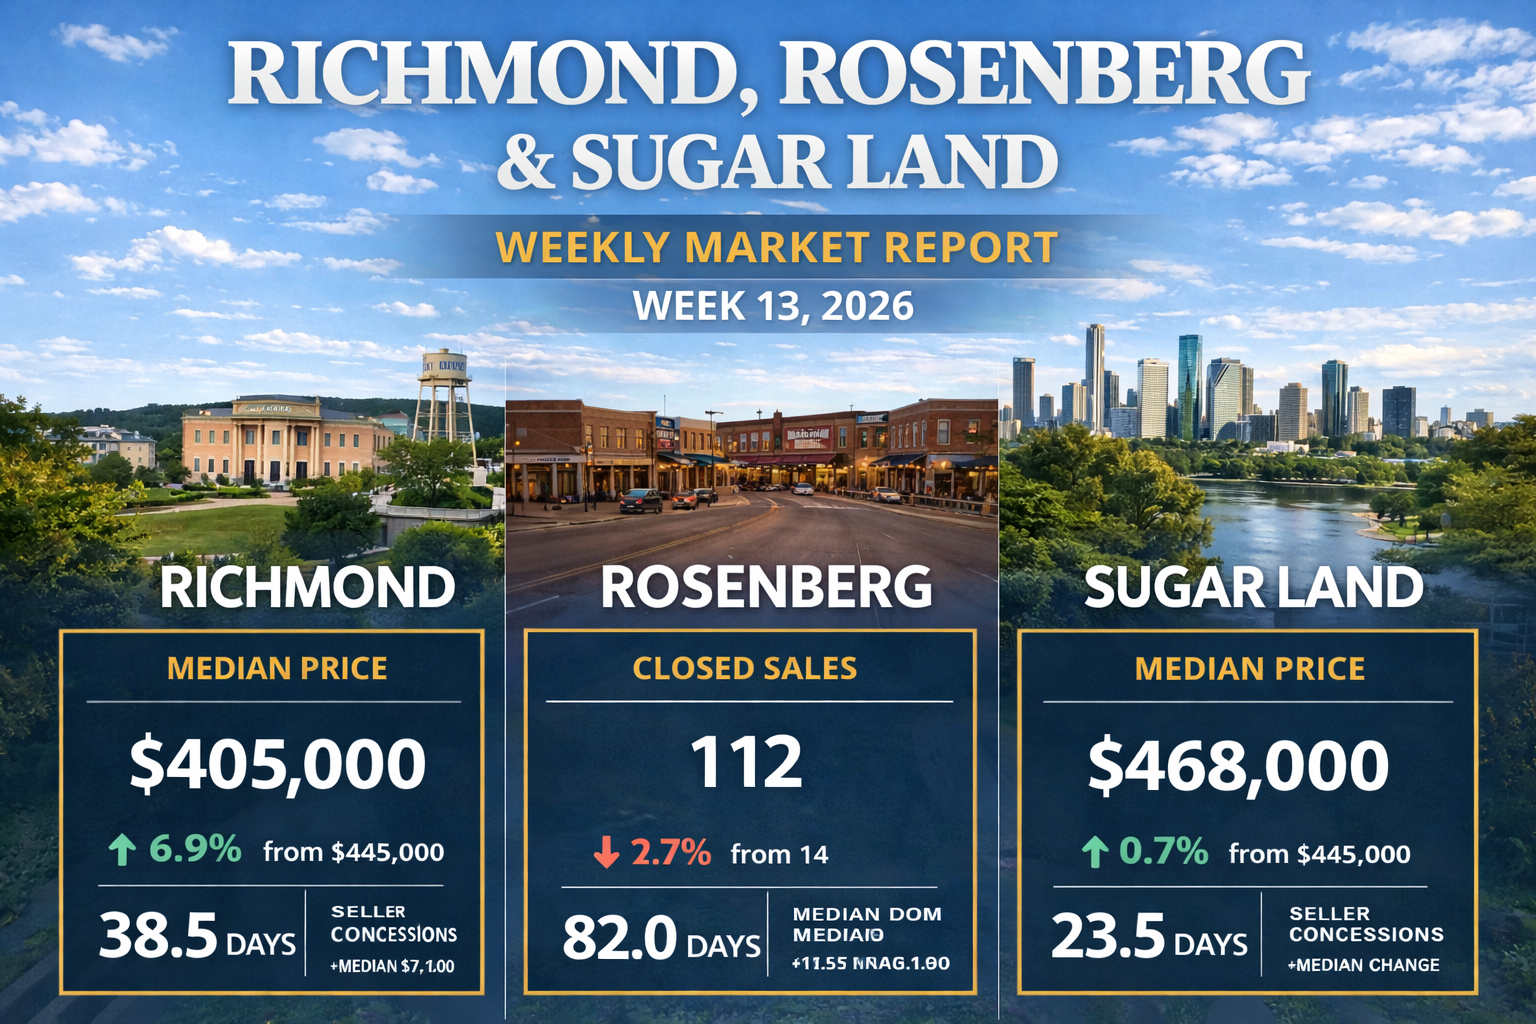
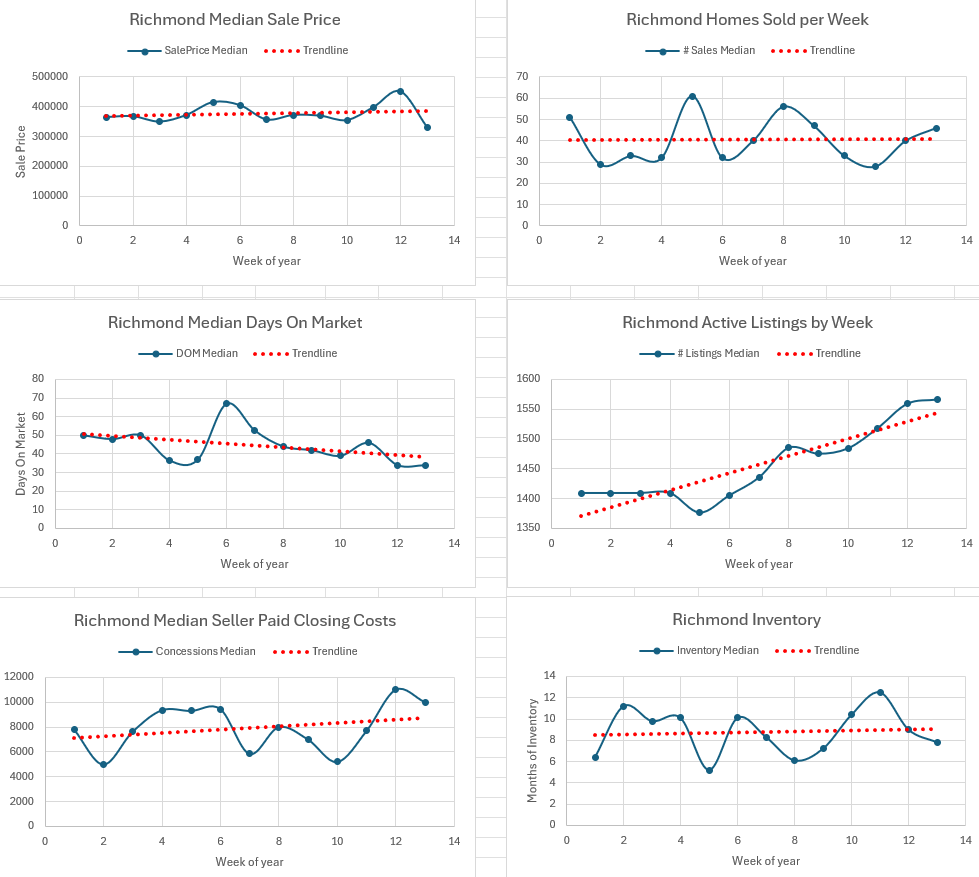
Richmond
Market Appreciation or Depreciation
The median closed price was $331,975, from $450,620 last week (↓ 26.3%).
Number of Closed Sales
46 homes closed this week, from 40 last week (↑ 15.0%).
Median Days on Market (DOM)
34.0 days, from 34.0 days last week (→ 0.0%).
Number of Listings (Total Inventory)
There were 1,566 total listings this week, from 1,559 last week (↑ 0.4%).
Months of Inventory
Based on the current sales pace, Richmond has 7.8 months of housing inventory, from 9.0 months last week (↓ 13.3%).
Active (A): 1,162 listings (↓ 0.1%)
Option Pending (OP): 31 listings (↑ 47.6%)
Pending Continue to Show (PSHO): 26 listings (→ no change)
Pending (P): 347 listings (↓ 0.6%)
Seller Concessions Over $1
Percentage of Sales with Concessions: 50.0% (↓ 9.1%)
Median Concession: $10,000 (↓ 9.1%)
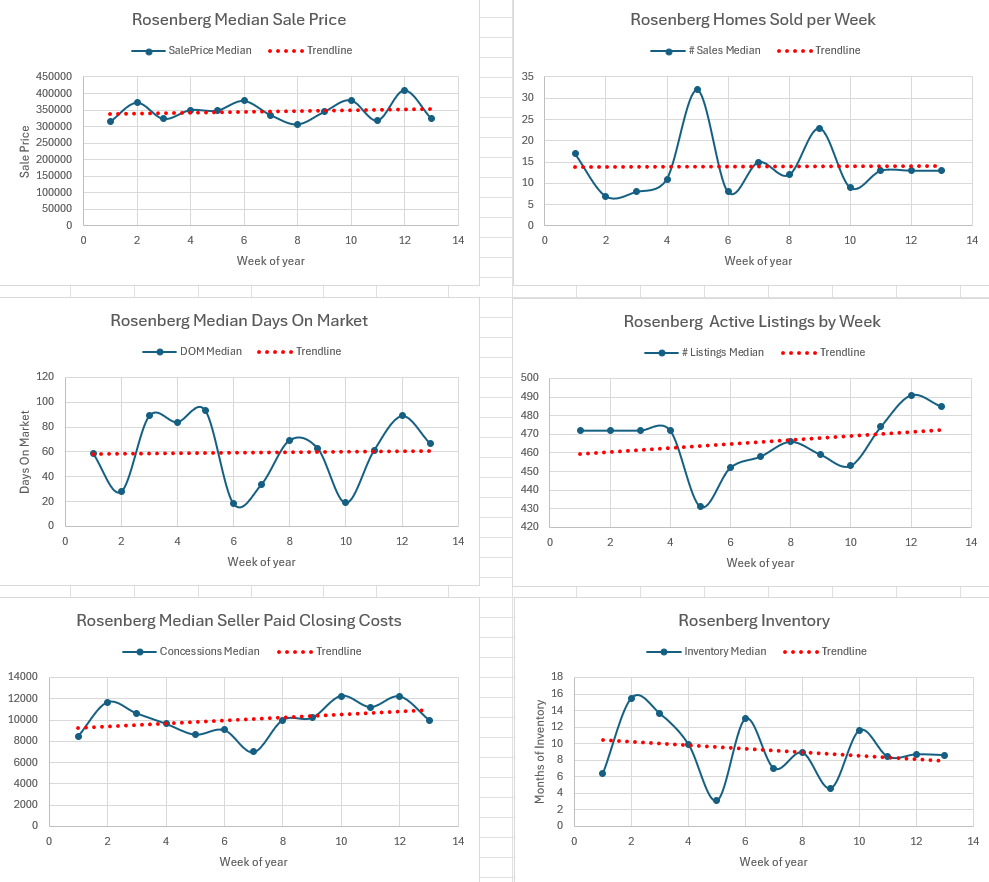
Rosenberg
Market Appreciation or Depreciation
The median closed price was $325,000, from $409,990 last week (↓ 20.7%).
Number of Closed Sales
13 homes closed this week, from 13 last week (→ 0.0%).
Median Days on Market (DOM)
67.0 days, from 89.0 days last week (↓ 24.7%).
Number of Listings (Total Inventory)
There were 485 total listings this week, from 491 last week (↓ 1.2%).
Months of Inventory
Based on the current sales pace, Rosenberg has 8.6 months of housing inventory, from 8.7 months last week (↓ 1.1%).
Active (A): 341 listings (↓ 4.2%)
Option Pending (OP): 10 listings (↓ 9.1%)
Pending Continue to Show (PSHO): 27 listings (↑ 12.5%)
Pending (P): 107 listings (↑ 7.0%)
Seller Concessions Over $1
Percentage of Sales with Concessions: 69.2% (↑ 12.5%)
Median Concession: $10,000 (↓ 18.0%)
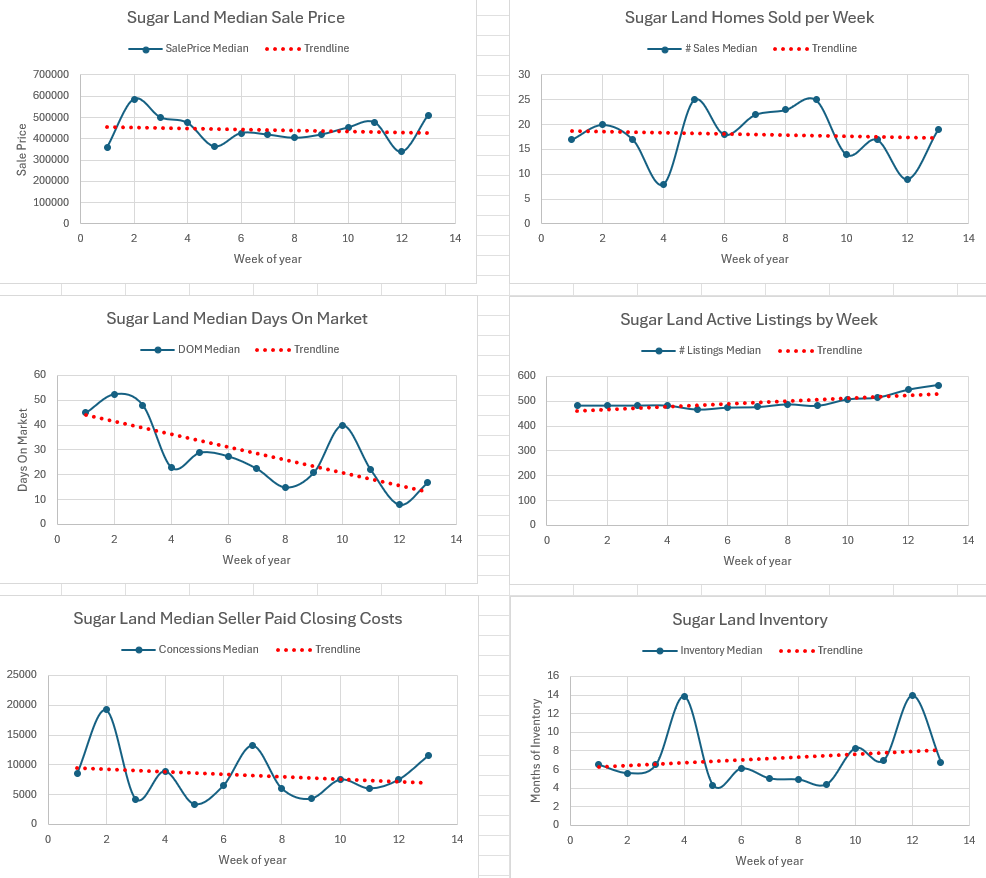
Sugar Land
Market Appreciation or Depreciation
The median closed price was $510,000, from $340,000 last week (↑ 50.0%).
Number of Closed Sales
19 homes closed this week, from 9 last week (↑ 111.1%).
Median Days on Market (DOM)
17.0 days, from 8.0 days last week (↑ 112.5%).
Number of Listings (Total Inventory)
There were 565 total listings this week, from 546 last week (↑ 3.5%).
Months of Inventory
Based on the current sales pace, Sugar Land has 6.8 months of housing inventory, from 14.0 months last week (↓ 51.4%).
Active (A): 447 listings (↑ 4.0%)
Option Pending (OP): 24 listings (↓ 7.7%)
Pending Continue to Show (PSHO): 8 listings (↓ 20.0%)
Pending (P): 86 listings (↑ 7.5%)
Seller Concessions Over $1
Percentage of Sales with Concessions: 31.6% (↓ 52.6%)
Median Concession: $11,500 (↑ 53.3%)
Legal Disclaimer
The information provided in this report is for informational purposes only and should not be considered financial, legal, or real estate advice. Data is derived from closed sales reported in the MLS and may be revised as late or corrected entries are posted.