Weekly Housing Market Report – Richmond, Rosenberg, and Sugar Land – Week 21 May 18, 2026 – May 24, 2026
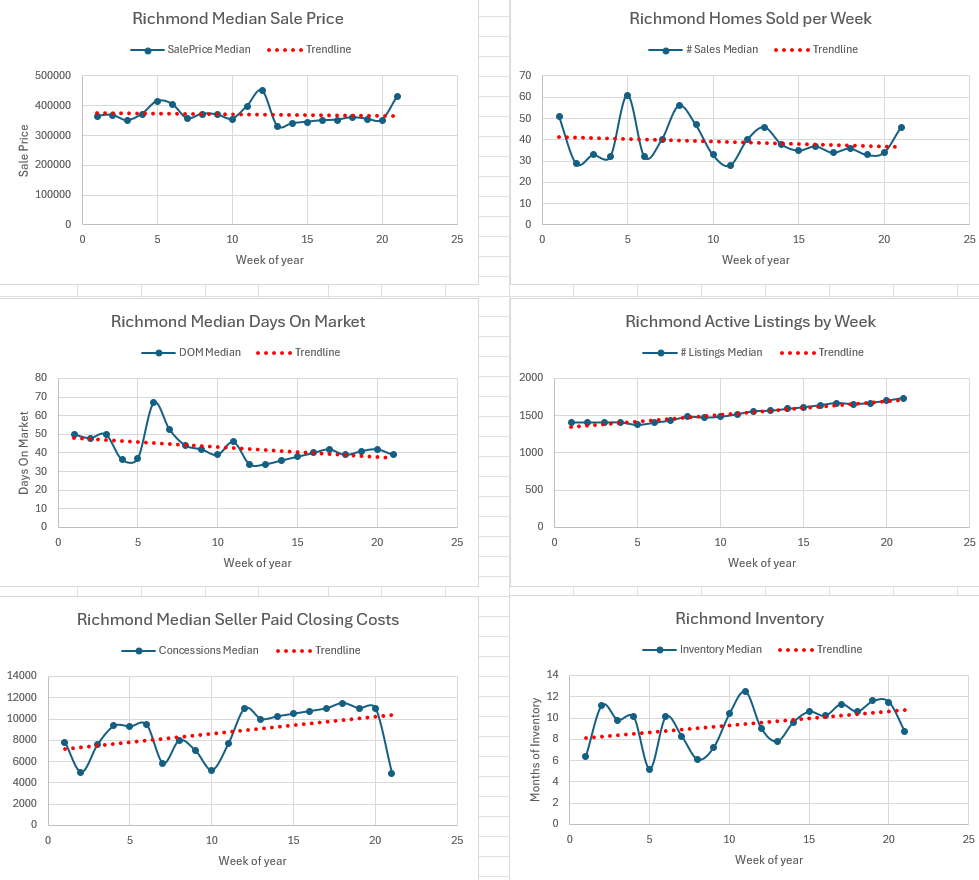
Richmond
Market Appreciation or Depreciation
The median closed price was $430,000, from $352,000 last week (↑ 22.2%).
Number of Closed Sales
46 homes closed this week, from 34 last week (↑ 35.3%).
Median Days on Market (DOM)
39.0 days, from 42.0 days last week (↓ 7.1%).
Number of Listings (Total Inventory)
There were 1,737 total listings this week, from 1,700 last week (↑ 2.2%).
Months of Inventory
Based on the current sales pace, Richmond has 8.7 months of housing inventory, from 11.5 months last week (↓ 24.3%).
Listing Breakdown
Active (A): 1,318 listings (↑ 3.8%)
Option Pending (OP): 42 listings (↑ 35.5%)
Pending Continue to Show (PSHO): 19 listings (→ 0%)
Pending (P): 358 listings (↓ 5.8%)
Seller Concessions Over $1
Percentage of Sales with Concessions: 47.8% (↓ 18.7%)
Median Concession: $4,925 (↓ 55.2%)
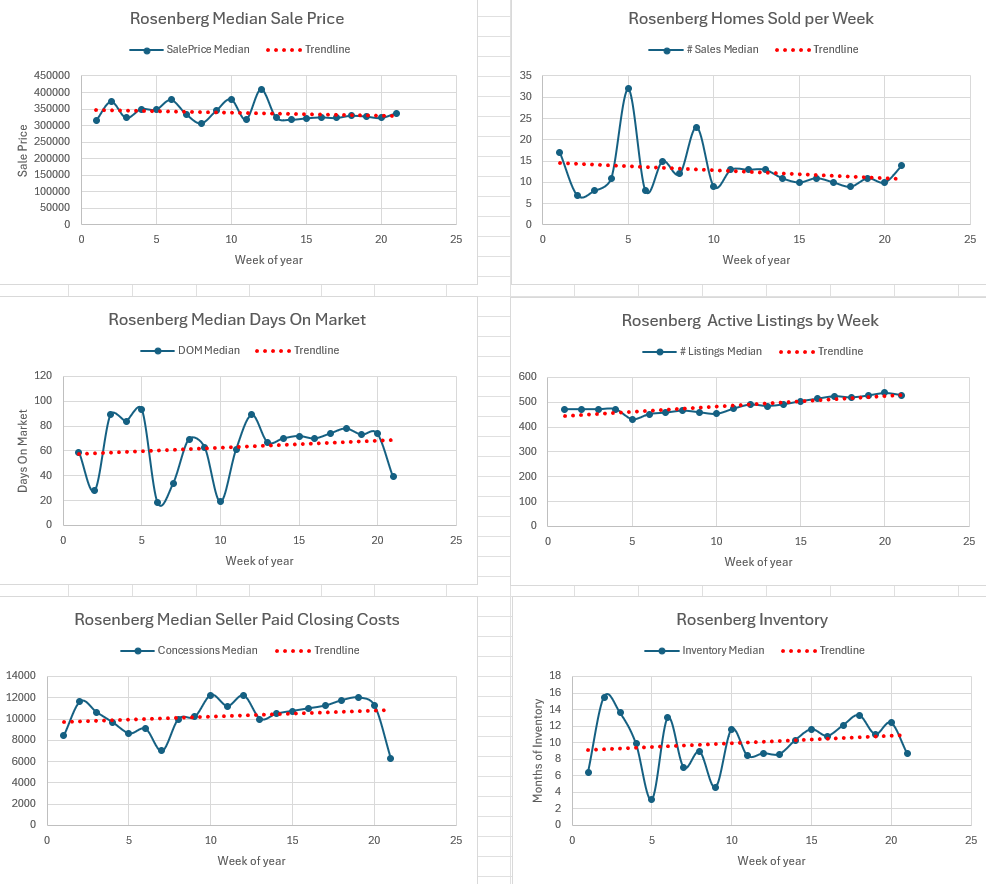
Rosenberg
Market Appreciation or Depreciation
The median closed price was $337,500, from $323,000 last week (↑ 4.5%).
Number of Closed Sales
14 homes closed this week, from 10 last week (↑ 40.0%).
Median Days on Market (DOM)
39.0 days, from 74.0 days last week (↓ 47.3%).
Number of Listings (Total Inventory)
There were 529 total listings this week, from 538 last week (↓ 1.7%).
Months of Inventory
Based on the current sales pace, Rosenberg has 8.7 months of housing inventory, from 12.4 months last week (↓ 29.8%).
Listing Breakdown
Active (A): 362 listings (↓ 3.7%)
Option Pending (OP): 10 listings (↓ 23.1%)
Pending Continue to Show (PSHO): 40 listings (↑ 66.7%)
Pending (P): 117 listings (↓ 6.4%)
Seller Concessions Over $1
Percentage of Sales with Concessions: 71.4% (↑ 2.0%)
Median Concession: $6,250 (↓ 44.4%)
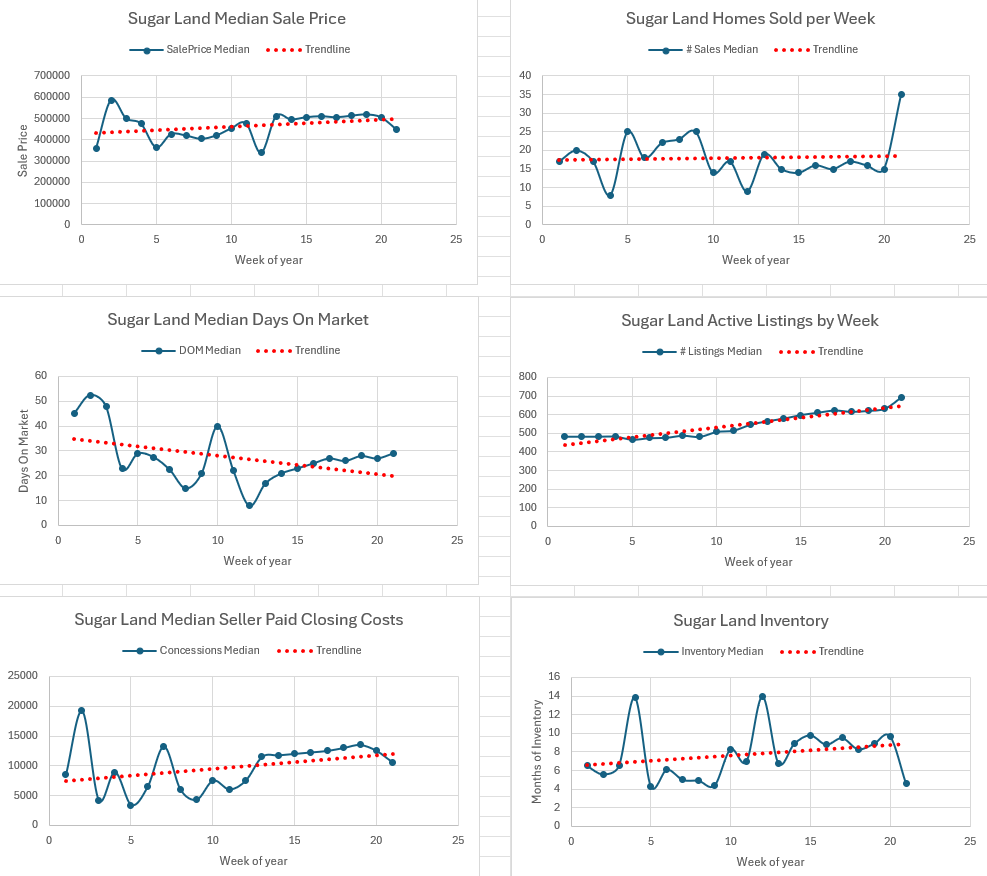
Sugar Land
Market Appreciation or Depreciation
The median closed price was $450,000, from $505,000 last week (↓ 10.9%).
Number of Closed Sales
35 homes closed this week, from 15 last week (↑ 133.3%).
Median Days on Market (DOM)
29.0 days, from 27.0 days last week (↑ 7.4%).
Number of Listings (Total Inventory)
There were 694 total listings this week, from 632 last week (↑ 9.8%).
Months of Inventory
Based on the current sales pace, Sugar Land has 4.6 months of housing inventory, from 9.7 months last week (↓ 52.6%).
Listing Breakdown
Active (A): 544 listings (↑ 10.3%)
Option Pending (OP): 39 listings (↑ 77.3%)
Pending Continue to Show (PSHO): 6 listings (↓ 50.0%)
Pending (P): 105 listings (→ 0%)
Seller Concessions Over $1
Percentage of Sales with Concessions: 17.1% (↓ 57.3%)
Median Concession: $10,500 (↓ 16.0%)
Legal Disclaimer
The information provided in this report is for informational purposes only and should not be considered financial, legal, or real estate advice. Data is derived from closed sales reported in the MLS and may be revised as late or corrected entries are posted.