

Weekly Housing Market Report – Katy and Fulshear – Week 23 June 1, 2026 – June 7, 2026
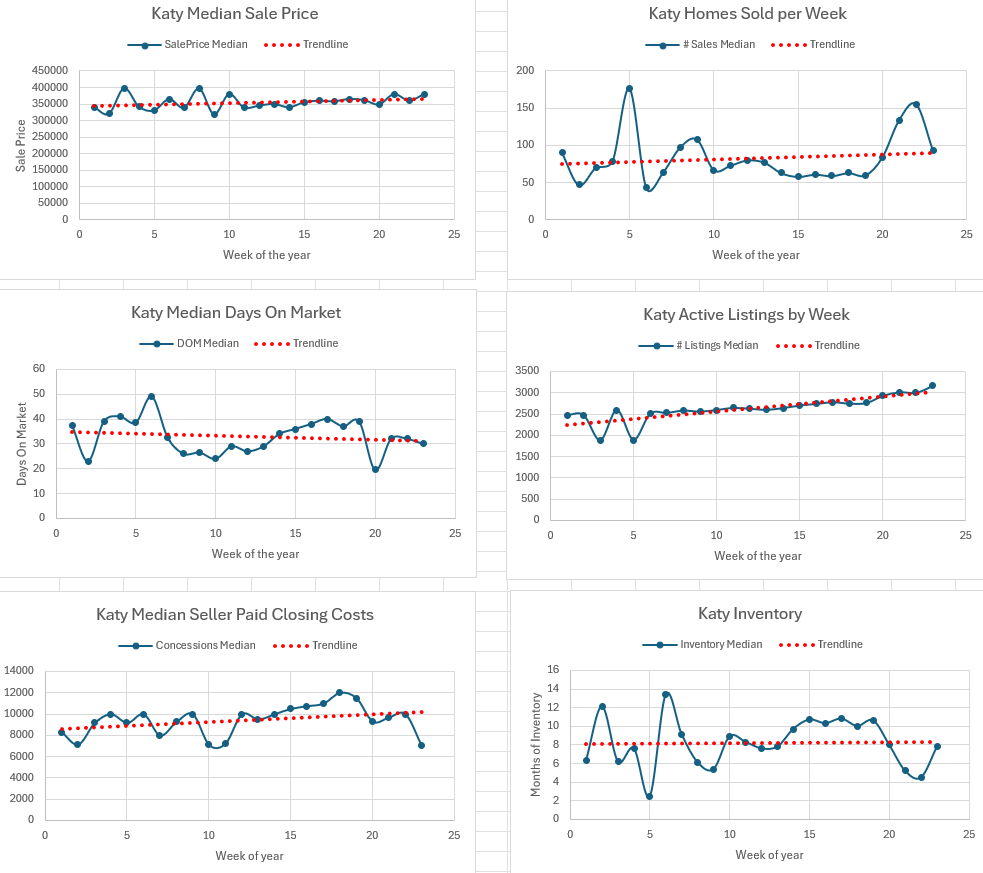
Katy
Market Appreciation or Depreciation
The median closed price in Katy this week was $380,000, from $359,990 last week (↑ 5.6%).
Number of Closed Sales
93 homes closed this week in Katy, from 155 last week (↓ 40.0%).
Median Days on Market (DOM)
30 days, from 32 days last week (↓ 6.3%).
Number of Listings (Total Inventory)
There were 3,168 total listings this week in Katy, from 3,005 last week (↑ 5.4%).
Median List Price
The median list price across all properties in Katy was $305,000 this week, from $309,990 last week (↓ 1.6%).
Months of Inventory
Based on the current sales pace, Katy has 7.8 months of housing inventory, from 4.5 months last week (↑ 73.3%).
Listing Breakdown
Active (A): 2,342 listings
Option Pending (OP): 82 listings
Pending Continue to Show (PSHO): 80 listings
Pending (P): 664 listings
Seller Concessions Over $1
Percentage of Sales with Concessions: 51.0%
Median Concession: $7,000
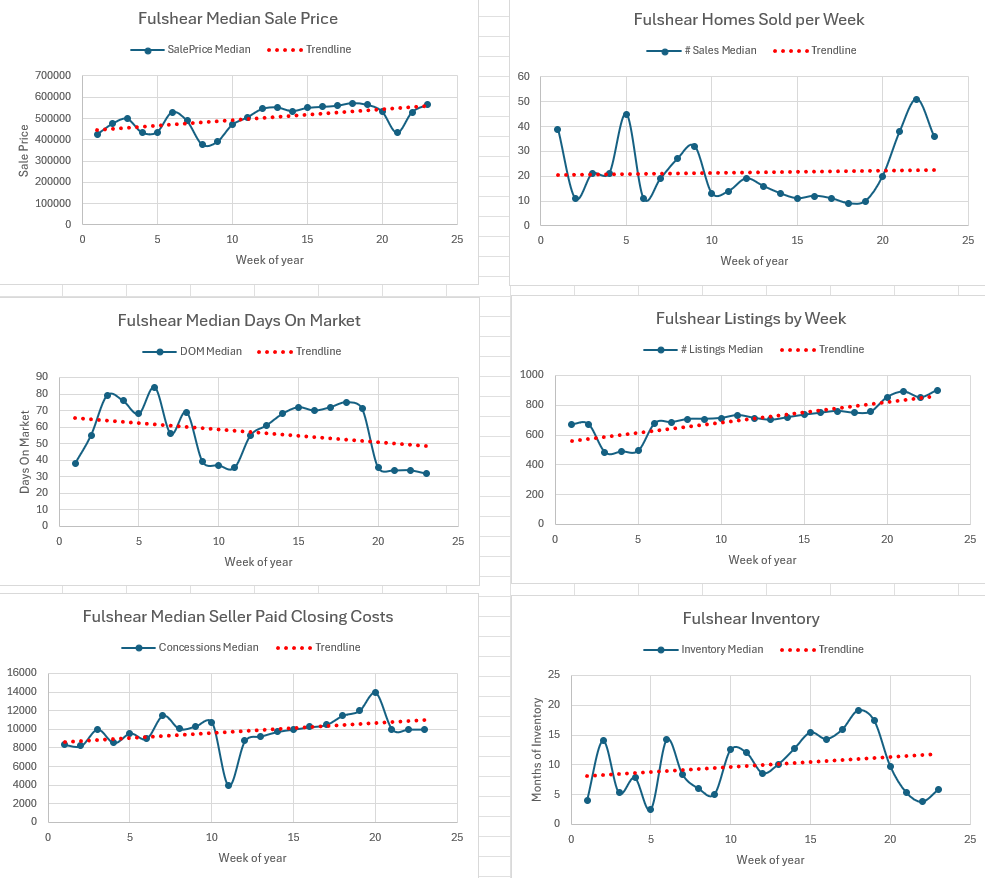
Fulshear
Market Appreciation or Depreciation
The median closed price in Fulshear this week was $564,449, from $529,990 last week (↑ 6.5%).
Number of Closed Sales
36 homes closed this week in Fulshear, from 51 last week (↓ 29.4%).
Median Days on Market (DOM)
32 days, from 34 days last week (↓ 5.9%).
Number of Listings (Total Inventory)
There were 900 total listings this week in Fulshear, from 851 last week (↑ 5.8%).
Median List Price
The median list price across all properties in Fulshear was $520,495 this week, from $525,000 last week (↓ 0.9%).
Months of Inventory
Based on the current sales pace, Fulshear has 5.8 months of housing inventory, from 3.8 months last week (↑ 52.6%).
Listing Breakdown
Active (A): 619 listings
Option Pending (OP): 17 listings
Pending Continue to Show (PSHO): 54 listings
Pending (P): 210 listings
Seller Concessions Over $1
Percentage of Sales with Concessions: 56.0%
Median Concession: $10,000
Legal Disclaimer
The information provided in this report is for informational purposes only and should not be considered financial, legal, or real estate advice. Data is derived from MLS information and may be revised as late or corrected entries are reported.