

Weekly Housing Market Report – Richmond, Rosenberg, and Sugar Land – Week 23 June 1, 2026 – June 7, 2026
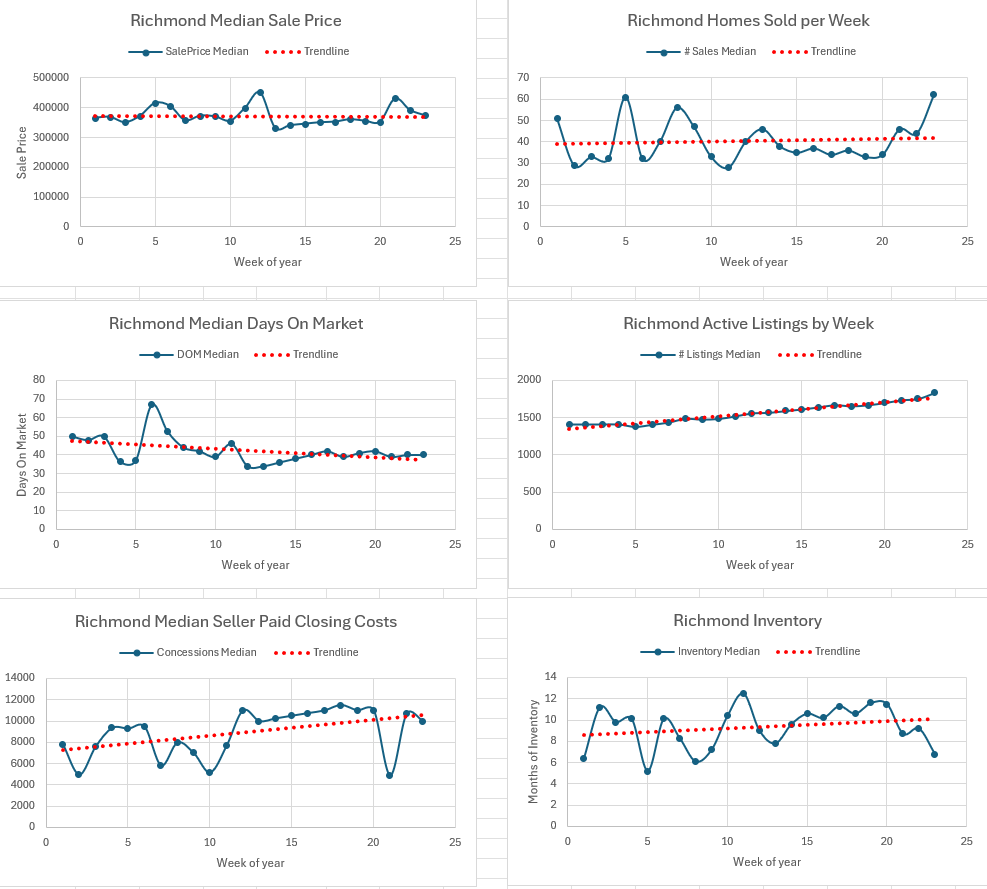
Richmond
Market Appreciation or Depreciation
The median closed price was $373,000, from $391,250 last week (↓ 4.7%).
Number of Closed Sales
62 homes closed this week, from 44 last week (↑ 40.9%).
Median Days on Market (DOM)
40.0 days, from 40.0 days last week (→ 0.0%).
Number of Listings (Total Inventory)
There were 1,837 total listings this week, from 1,755 last week (↑ 4.7%).
Median List Price
The median list price was $385,000, from $390,000 last week (↓ 1.3%).
Months of Inventory
Based on the current sales pace, Richmond has 6.8 months of housing inventory, from 9.2 months last week (↓ 26.1%).
Listing Breakdown
Active (A): 1,415 listings (↑ 5.6%)
Option Pending (OP): 46 listings (↑ 31.4%)
Pending Continue to Show (PSHO): 18 listings (↓ 14.3%)
Pending (P): 358 listings (↓ 0.3%)
Seller Concessions Over $1
Percentage of Sales with Concessions: 47.0% (↓ 17.5%)
Median Concession: $10,000 (↓ 6.3%)
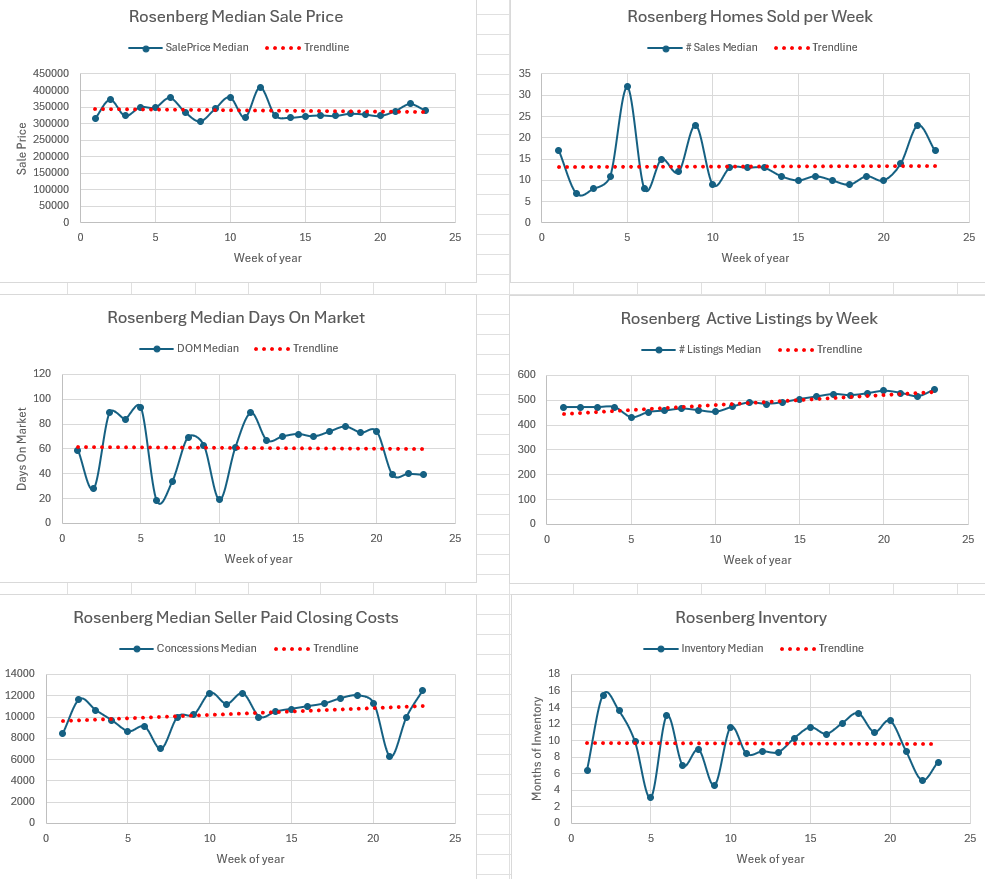
Rosenberg
Market Appreciation or Depreciation
The median closed price was $339,990, from $359,440 last week (↓ 5.4%).
Number of Closed Sales
17 homes closed this week, from 23 last week (↓ 26.1%).
Median Days on Market (DOM)
39.0 days, from 40.0 days last week (↓ 2.5%).
Number of Listings (Total Inventory)
There were 545 total listings this week, from 516 last week (↑ 5.6%).
Median List Price
The median list price was $363,315, from $364,999 last week (↓ 0.5%).
Months of Inventory
Based on the current sales pace, Rosenberg has 7.4 months of housing inventory, from 5.2 months last week (↑ 42.3%).
Listing Breakdown
Active (A): 397 listings (↑ 7.0%)
Option Pending (OP): 6 listings (↓ 33.3%)
Pending Continue to Show (PSHO): 29 listings (↓ 3.3%)
Pending (P): 113 listings (↑ 6.6%)
Seller Concessions Over $1
Percentage of Sales with Concessions: 65.0% (↓ 25.3%)
Median Concession: $12,500 (↑ 25.0%)
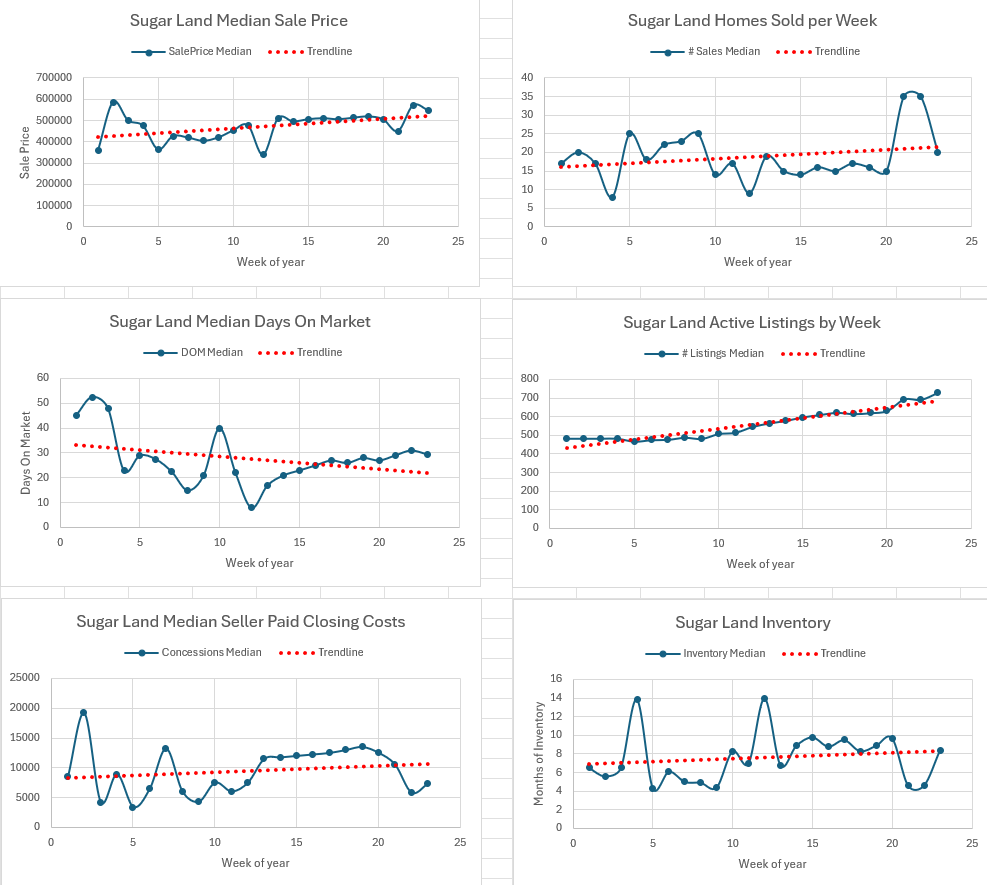
Sugar Land
Market Appreciation or Depreciation
The median closed price was $547,500, from $570,000 last week (↓ 3.9%).
Number of Closed Sales
20 homes closed this week, from 35 last week (↓ 42.9%).
Median Days on Market (DOM)
29.5 days, from 31.0 days last week (↓ 4.8%).
Number of Listings (Total Inventory)
There were 729 total listings this week, from 692 last week (↑ 5.3%).
Median List Price
The median list price was $499,888, from $519,786 last week (↓ 3.8%).
Months of Inventory
Based on the current sales pace, Sugar Land has 8.4 months of housing inventory, from 4.6 months last week (↑ 82.6%).
Listing Breakdown
Active (A): 586 listings (↑ 7.7%)
Option Pending (OP): 32 listings (↓ 15.8%)
Pending Continue to Show (PSHO): 5 listings (↓ 16.7%)
Pending (P): 106 listings (↑ 1.9%)
Seller Concessions Over $1
Percentage of Sales with Concessions: 50.0% (↑ 61.3%)
Median Concession: $7,300 (↑ 25.9%)
Legal Disclaimer
The information provided in this report is for informational purposes only and should not be considered financial, legal, or real estate advice. Data is derived from MLS activity and may be revised as late or corrected entries are posted.